Markets & Property
I started investing at 18. Then the banks started failing.
A red passbook, a £1,000 cheque and an unfortunate introduction to the stock market. What nearly twenty years taught me about crashes, recovery and compounding.
In December 2006, I opened my first investment account. I was eighteen, I had saved about £1,000, and I was taking my first sensible step towards the future.
The global financial system chose this moment to develop some fairly serious problems.
My timing was excellent. Just in entirely the wrong direction.

Before the investment account, there was a Britannia Building Society savings account and a red passbook. The money had taken time to build up, including work at a hotel. At eighteen, £1,000 was a substantial sum. It represented hours worked, money put aside and things I hadn’t bought.
Opening an account with TD Waterhouse involved paper forms, an envelope and the post. My first investment travelled by cheque.
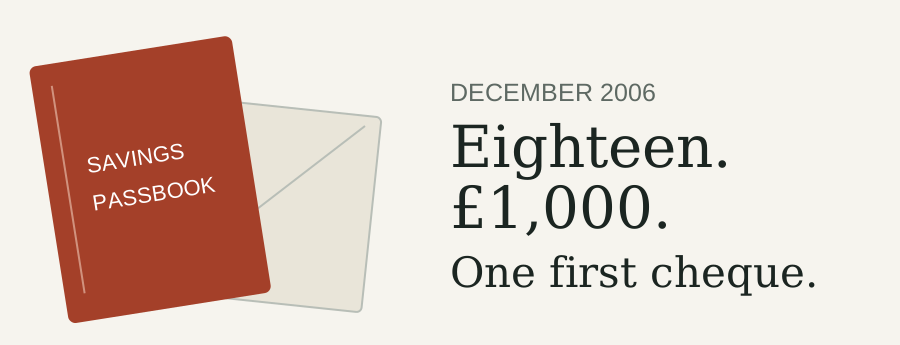
There was something reassuringly deliberate about it. You couldn’t move the money with an accidental tap while ordering a takeaway. You had to find a pen.
The plan was simple: invest across companies around the world, leave the money alone and give it time to grow.
I had the account. I had the money invested.
What arrived next was a rather demanding induction.
By September 2007, people were queuing outside Northern Rock. On 14 September, the Bank of England announced emergency support for the bank. A year later, on 15 September 2008, Lehman Brothers collapsed. (Northern Rock announcement, Lehman chronology)
Banks were supposed to be the reassuring part.
Solid buildings. Serious people. Institutions trusted to look after money.
Suddenly, the institutions themselves were in trouble.
And here I was, barely into adulthood, having decided that putting my savings into the stock market was a sensible thing to do.
A crash looks quite manageable on a chart drawn twenty years later. There’s the fall. There’s the bottom. There’s the recovery. You can follow the line with your finger and arrive safely at the other side.
Living through it, you only get the chart up to today.
The rest is blank.
You don’t know whether the next fall will be the last one. A promising recovery might turn out to be a brief pause before things get worse. The headlines keep coming, and each one offers another reason to wonder how much further this can go.
Every recovery chart contains a moment when the people living through it had no idea it would become a recovery chart.
The value of my investments fell.
Calling it a “paper loss” didn’t make it feel especially theoretical. It was money I had worked for, and my investment was worth less.
But I didn’t cash out.
To put some scale around that experience, consider a historical global-tracker example.
This uses the iShares MSCI World fund, with income reinvested and its returns converted into pounds. It illustrates the market journey; it isn’t a reconstruction of my account.
Starting with £1,000 on 29 December 2006, the example rose to approximately £1,108 in October 2007.
By March 2009, it was worth about £688.
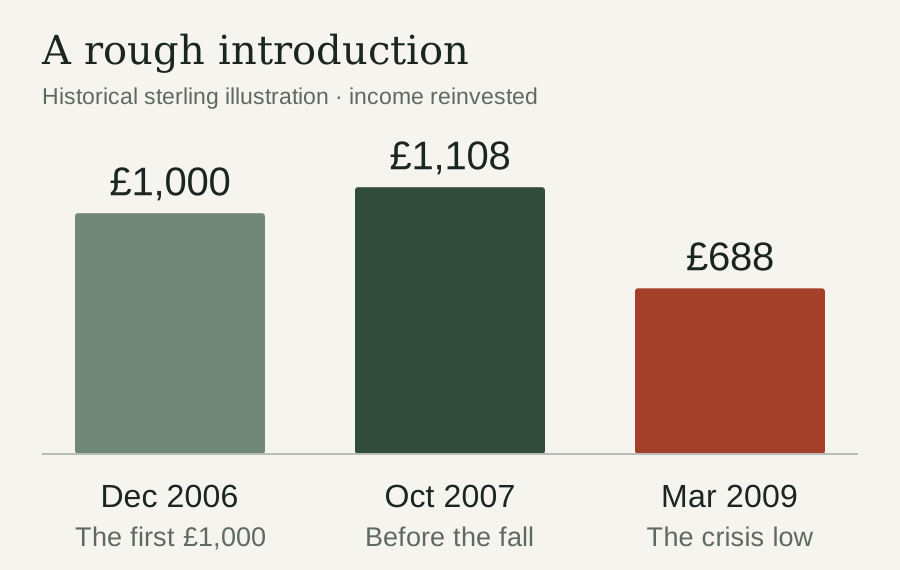
That is about 31% below the original investment, and 38% below the high it reached along the way.
Those are different numbers measuring different things. Neither would have made a particularly cheerful account statement.
It also explains why I built the Global Market Drawdown Monitor. A fall makes more sense when you can see what it is measured against, how it compares with earlier falls and how long recoveries have taken.
Context doesn’t remove the discomfort. It gives the discomfort a scale.
I kept putting money in.
First by cheque, later by BACS. The payment technology improved considerably. The market continued to have its moments.
When prices fell, new contributions could buy more units. Meanwhile, the investments I already owned were worth less.
Both things were happening at once.
There was no announcement telling me the worst was over. No reassuring letter saying that normal service had resumed and I could stop worrying.
The recovery became obvious afterwards.
And then, of course, there were more dips.
There were sell-offs in 2011 and 2018. Covid brought another sharp fall in 2020. Then came another difficult year in 2022.
The reasons changed. The feeling of watching investments go backwards became familiar.
Nearly twenty years of investing provides plenty of opportunities to practise being uncomfortable.
It also teaches you how rarely the world offers a perfect moment. There is almost always a worrying headline, an expensive-looking market, an election, a conflict or someone confidently explaining why everything is about to collapse.
If I had required universal reassurance before investing, the money might still be waiting beside the red passbook.
Now pull the lens back.
Take that same illustrative £1,000 from December 2006. Leave it invested, reinvest the income and exclude every later contribution.
By 19 November 2026, it had grown to approximately £6,467.
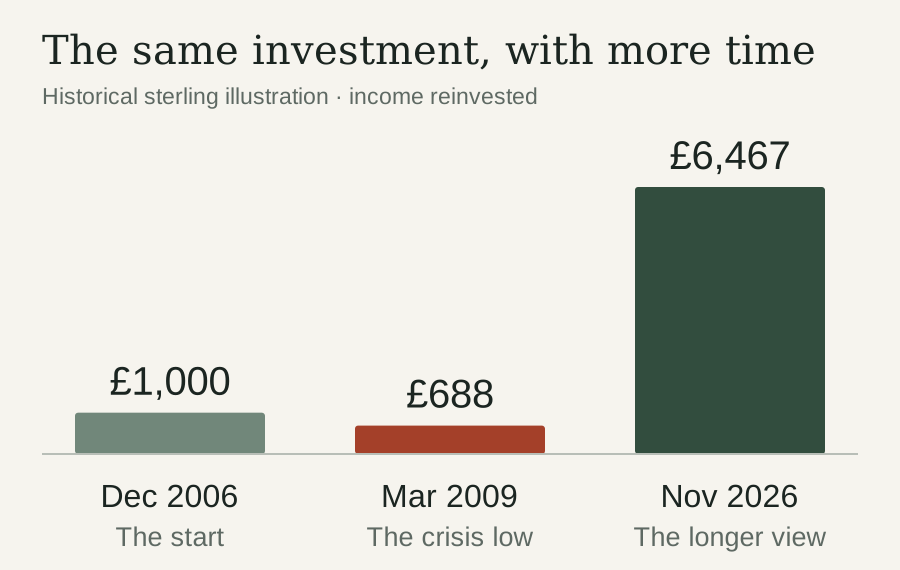
The crash is still there.
The loss still happened.
But the years afterwards change its place in the story.
At the beginning, the financial crisis seemed enormous because it occupied so much of my investing experience. With nearly twenty years behind me, I can see the recovery, the growth and all the other difficult stretches that followed.
My own investments are now massively up from that early drop. Market recovery and compounding have had years to work.
That doesn’t mean the journey felt comfortable throughout. It means the uncomfortable part at the beginning didn’t decide the ending.
Compounding is easy to explain and surprisingly difficult to be patient with.
A 10% gain turns £1,000 into £1,100. Another 10% takes it to £1,210.
The second gain is larger because the earlier growth is earning a return too.
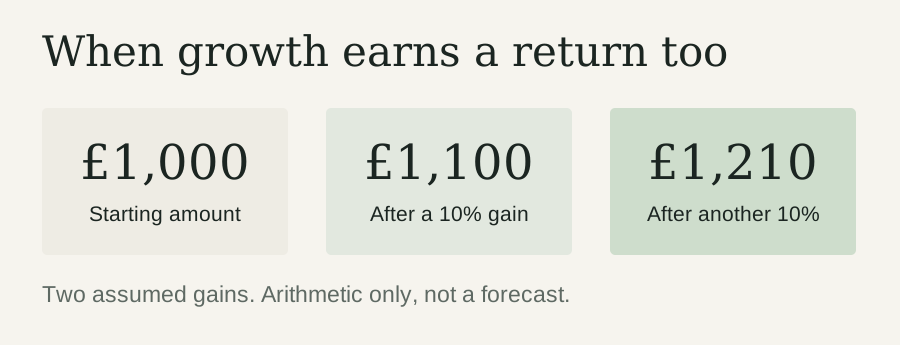
People often call this compound interest. With shares, compounding returns is the more accurate description: growth builds on earlier growth, and reinvested income can produce further income and gains.
The arithmetic is wonderfully tidy.
The market has never felt obliged to cooperate with the diagram.
Real returns arrive unevenly. Some years are excellent. Others undo progress. Losses compound too. There is no fixed annual rate quietly ticking away in the background.
But, over this historical period, leaving money invested and reinvesting income allowed recovery and growth to build on each other.
Later contributions added more savings to the process. Those deposits were separate from investment profit, but each brought another amount of money with time ahead of it.
Costs matter for the same reason. A small charge keeps taking a slice, year after year. That is why my Global Fund Finder puts ongoing fund charges into pounds: percentages become much easier to judge when you can see what they cost.
And when markets become noisy, the Market Mood Monitor gives some context on volatility. It cannot tell me when the next recovery starts. Neither, unfortunately, can a more determined refresh of the account page.
I opened that first account at eighteen.
The crash could easily have become the whole story: the time I tried investing, watched the value fall and decided it wasn’t for me.
Instead, there was another cheque. Another contribution. Another year.
Then enough years to look back and see something the account statement in 2008 couldn’t show me: what happened next.
There is no prize for starting just before a financial crisis. Given the choice, I would have accepted a quieter introduction. Perhaps a leaflet.
But I’m glad that a frightening start didn’t become an early finish.
The red passbook, the paper forms and the first cheque belong to a different era now. The habit survived.
That first £1,000 took time to save. Giving it time to grow became the next part of the job.
Chart notes: the comparison uses the iShares MSCI World UCITS ETF, a developed-market fund that excludes emerging markets. It does not identify my original holding. The representative start date is 29 December 2006 because the exact purchase date is unknown. Calculations use the issuer’s USD total-return series, which assumes income reinvested, converted to sterling using ECB reference rates. Fund operating expenses affect the figures; platform, dealing, spread, currency conversion, reinvestment costs and personal taxes are excluded. The retained data ends on 19 November 2026. Past performance does not guarantee future returns.