Forward P/E / next 12 months
15.70x
11% below the nine-snapshot median of 17.70x.
Below recent sampleFinance / Market valuation
A broad developed- and emerging-markets view, compared with its own valuation history. The headline scale shows the long-run CAPE rank; shorter P/E samples add context.
Latest figures are a dated snapshot; they do not refresh automatically.
Overall reading / long-run CAPE
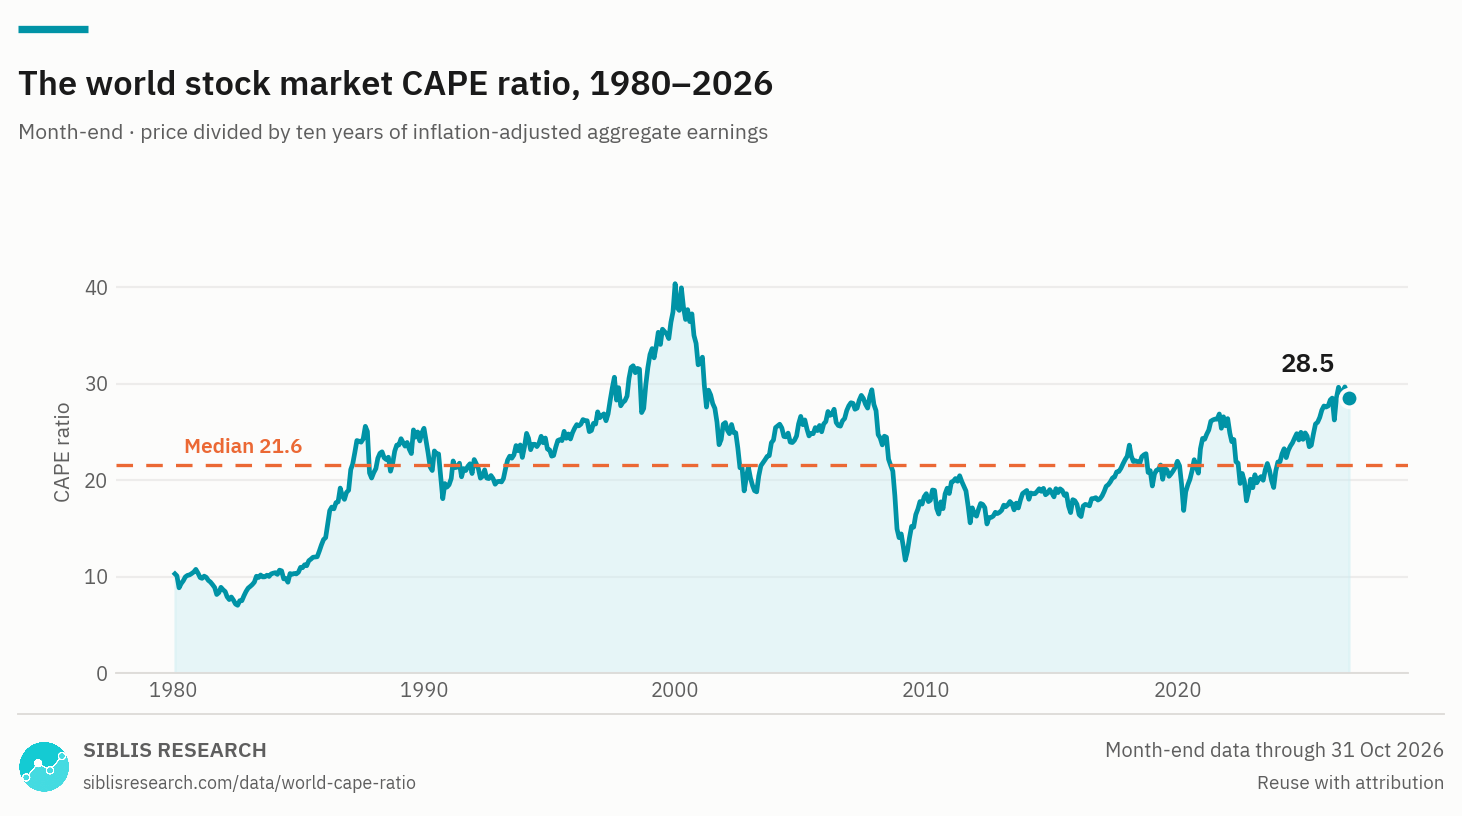
The global CAPE is at the 91st percentile: 91% of 562 month-end readings since 1980 were lower, and 9% were higher. CAPE is 32% above its published median of 21.64x.
This is a historical rank, not a universal fair-value estimate or a signal for when prices may move.
Valuation matrix
The long-run label comes from CAPE. Forward and trailing P/E are currently below the median of their nine available snapshots, but that short sample is not enough to call the market cheap over the long term.
Forward P/E / next 12 months
15.70x
11% below the nine-snapshot median of 17.70x.
Below recent sampleTrailing P/E / last 12 months
21.09x
2% below the nine-snapshot median of 21.60x.
Slightly below recent sampleCAPE / 10 years of real earnings
28.54x
32% above the long-run median of 21.64x; 91st percentile.
Expensive versus long-run historyForward and trailing P/E reference the nine selected API dates from December 2023 to September 2026. CAPE uses 562 published month-end readings since 1980.
Dated observations
The line connects the nine selected API observations to the latest published figure on 31 October 2026. The gaps between dates contain no monthly values; the connecting segments are visual guides only.
Forward P/E selected / 10 dated observations shown.
| Observation | Forward P/E | Trailing P/E | CAPE |
|---|---|---|---|
| Dec 2023 | 16.71x | 19.99x | 21.91x |
| Jun 2024 | 17.46x | 20.97x | 23.56x |
| Dec 2024 | 17.93x | 21.60x | 24.25x |
| Mar 2025 | 17.34x | 20.86x | 23.49x |
| Jun 2025 | 18.75x | 22.02x | 25.84x |
| Sep 2025 | 19.41x | 23.12x | 27.28x |
| Dec 2025 | 18.89x | 23.12x | 27.71x |
| Jun 2026 | 17.70x | 23.56x | 29.12x |
| Sep 2026 | 16.31x | 21.60x | 29.05x |
| Oct 2026 (latest) | 15.70x | 21.09x | 28.54x |
Long-run view
28.54x / 91th percentile
This published monthly chart shows the current CAPE against 562 month-end readings. CAPE smooths earnings over a decade, so it moves slowly and is not a short-term timing tool.
Scope and method
Forward P/E compares current market value with analysts' consensus for the next twelve months. Forecasts are uncertain. The free historical feed includes selected period ends only.
Trailing P/E uses recent reported earnings. At a recession low, earnings can fall sharply and make this ratio rise even after prices have dropped.
CAPE divides market value by ten years of inflation-adjusted aggregate earnings. The long-run chart is reproduced from the source; its monthly values are not republished here.
The scale compares valuations with their own history, a common approach in published market research. MSCI compares forward P/E with historical averages, while RBC GAM describes a multi-measure valuation composite. This page uses the published long-run CAPE percentile for its headline; nine recent P/E snapshots are too few to make a comparable long-run composite.
The Siblis global stock-market aggregate covers developed and emerging markets, including the US. It is not an official MSCI index and does not exactly match the holdings of a particular all-world fund.
The free Siblis API is provided for non-commercial use. This page uses selected observations with visible attribution and does not offer a data download. A complete monthly forward P/E history is not available in the free feed.
Data sources: Siblis global market valuations /World CAPE history /Free API scope and terms.
Educational market context only. Valuation ratios do not predict short-term market moves or tell anyone what to buy or sell.